New JavaScript components for animating weather data like temperature, wind flow, or any other scientific information were developed by our team. You can use weather data endpoint from us or process your own data with prepared workflows and integrate the functionality with your website and get attractive and easy-to-understand animations with 60 frames per second directly in a web browser - as part of your own branded applications.
Wind particles animation in GL JS maps
Data like wind and wave datasets allow visualization with particles clearly showing direction and speed in an animated way.
Our advanced display technology is able to capture the movement of wind or waves in time: you can see particles smoothly changing course as the wind starts blowing from the other direction.
Higher clarity can be achieved by setting colors based on the intensity of wind or waves.
Animations run in any contemporary web browser using WebGL.
Smooth visualization of gridded data in a browser
Displaying huge amounts of data, even datasets covering the entire planet is possible thanks to the tiling technology. Data are not shown at once but cut into smaller parts that can be loaded when they are needed for a certain area or zoom level. Details start to appear as you zoom in.
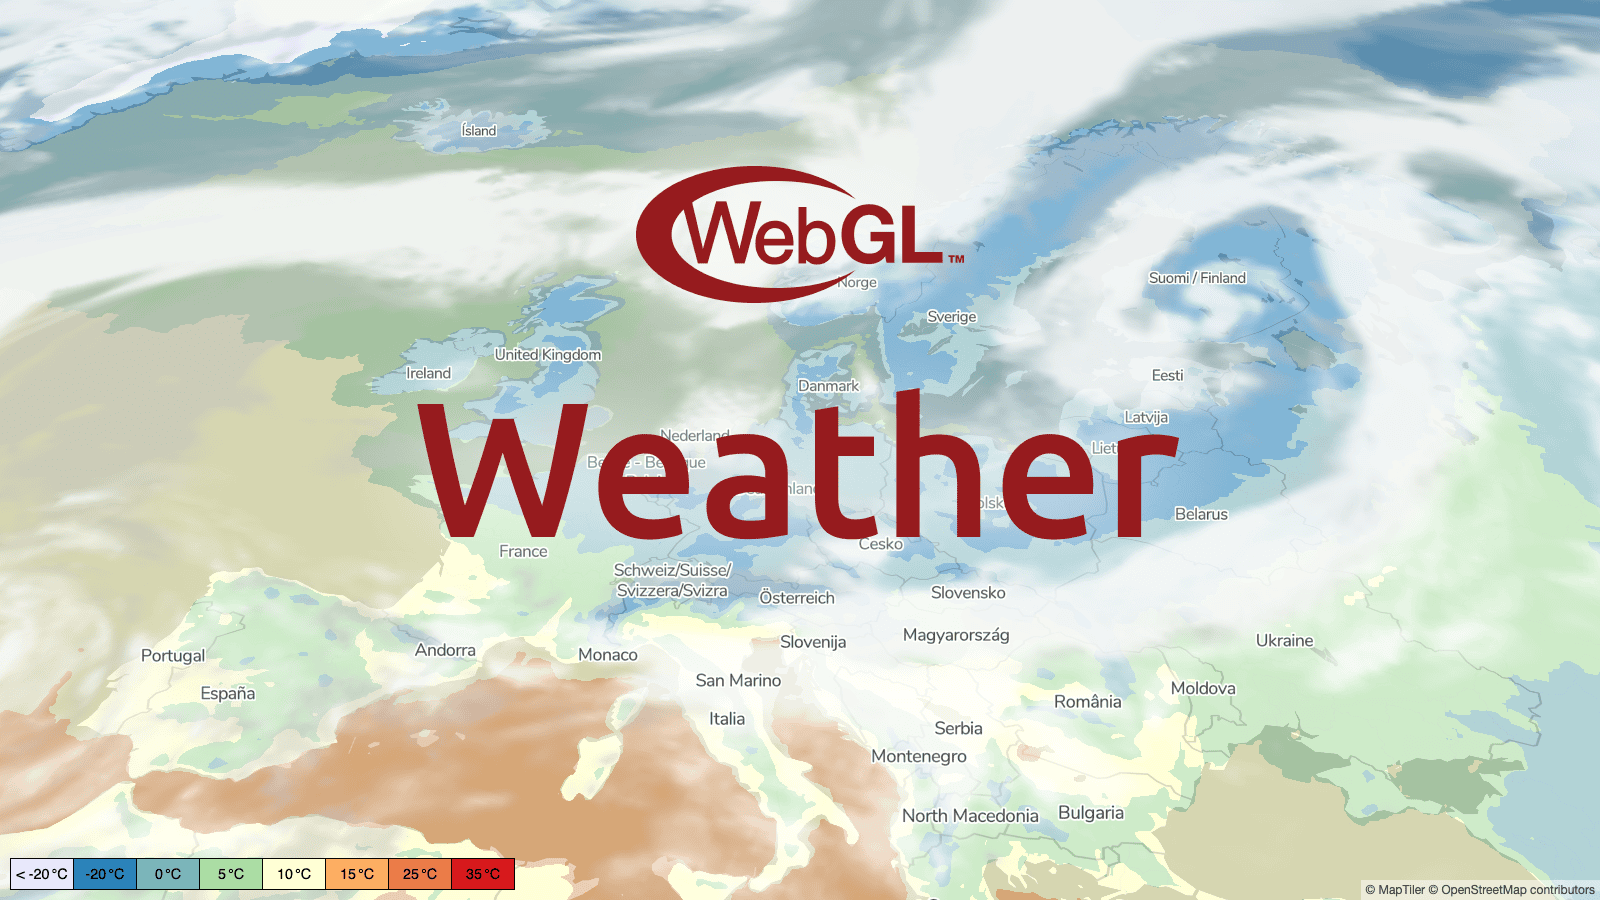
Visualization can be used for displaying temperature, humidity, clouds, precipitation, and much more! Additional data can be loaded seamlessly. All animations of temporal gridded data can run in a browser with a timeline, where you can stop at any time to investigate the weather data at a given time.
A better understanding of weather phenomenons is achieved via the coloring of data. It is possible to easily set your own color palette because true intensity values are encoded directly in tiles.
Open-source MapLibre GL JS as Mapbox alternative
All animations run in regular web browsers using MapLibre GL JS (an open-source Mapbox GL JS fork). You can manipulate the view as you wish - zoom in and out, rotate, and tilt the view.
High performance is secured by using hardware acceleration: technology widely used in the gaming industry. Rendering of data is done using WebGL shaders, which gives your data a more realistic look.
READ MORE ABOUT THE WEATHER PRODUCT
How does it work?
Processing raw data into web-optimized tiles allows us gradually loading only the area and the level of detail that is needed at a given time. Each time frame of the weather data (e.g. forecast at different times) is processed as a separate tile pyramid, which allows us to load additional frames into the existing client-side animation as soon as they are available.
The processed tiles contain the original meteorological values (e.g. temperature, wind speed, cloud coverage) and the final colorization is done client-side in the web browser (utilizing the power of WebGL). This allows us to interpolate the data values between the available forecasted time frames to achieve beautiful smooth animations.
Another great advantage of this approach is that the look & feel of the visualization is configurable (without having to reprocess the original data) - custom color scales, cut-off thresholds, etc. can all be done just by reconfiguring the visualization client-side component.
Smooth animations are achieved by gradually loading data tiles technology that loads when needed for a particular area or zoom level.
This allows users to display vast amounts of data in a very short time, even showing datasets covering the entire planet in a few seconds.
Everything runs on mobile as well: visualizations are optimized for touch devices.
Visualization for your weather website
MapTiler provides a full-stack for developing its own weather forecast application: base maps, data processing tools (ability to process custom weather data in GRIB2 and NetCDF format), and the above-described JavaScript components for visualization. If you are interested to use it on your website, please contact us.
Weather visualizations were created as a common R&D project in cooperation with the National Center of Meteorology UAE. NCM UAE is the first adopters powering their weather forecast portal and displaying their own data.